Bar graphs are an easy way for young children to sort and keep track of different items. Bar graphs also give kids a simple way to compare different groups of items since they can estimate how many of each item they have observing how tall each column on the bar graph is. These bar graph worksheets will challenge your child to create bar graphs and to correctly read bar graphs, as well as answer questions about the information depicted on the bar graphs.
Pictographs
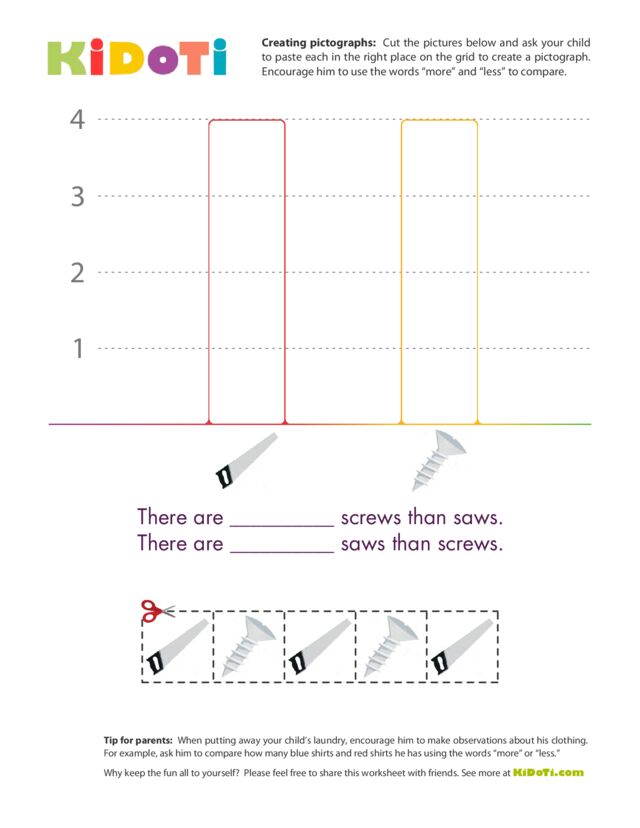
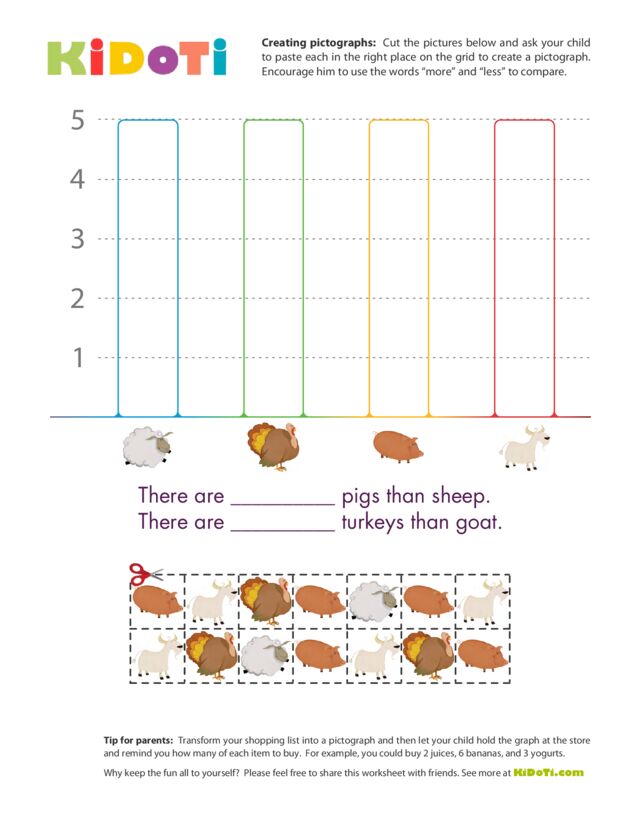
Pictographs are a basic form of bar graph that are especially simple for young children to create and understand. With their colorful pictures and simple directions, pictographs will help children learn the basics of graphing. These pictograph worksheets will encourage your child to make his own pictograph by cutting apart the pictures at the bottom of the page and then pasting each picture into the correct column on the graph.
A pictograph (sometimes called a pictogram) is a special type of graph that uses pictures or symbols to represent information. Because pictographs do not require any words or numbers, they are perfect for young children who cannot yet read or who are not yet comfortable identifying printed numbers and matching them to the amounts they represent.
Pictographs are an important part of a preschool or kindergarten math program because they are an easy way for children to learn about bar graphs and the important role bar graphs play in organizing and tracking the amounts of different items.
More about the importance of bar graph worksheets
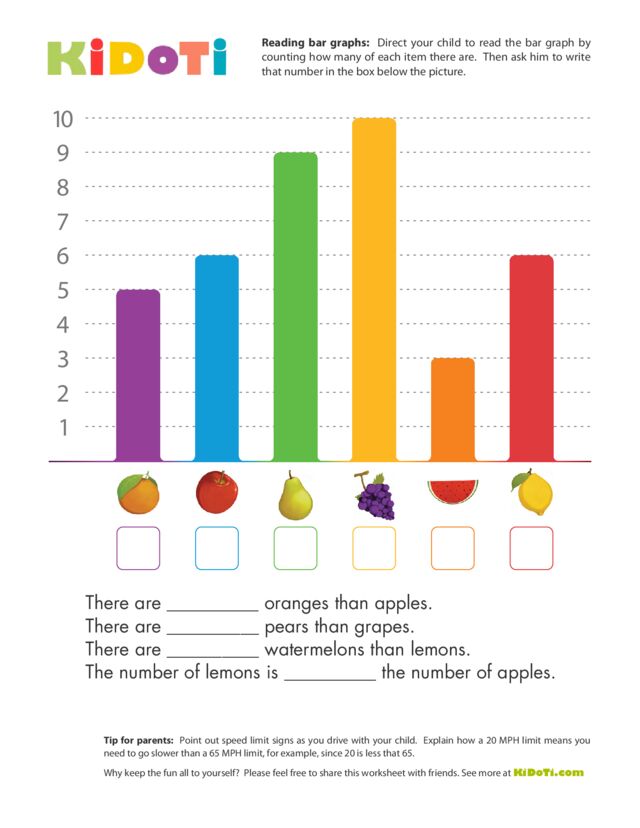
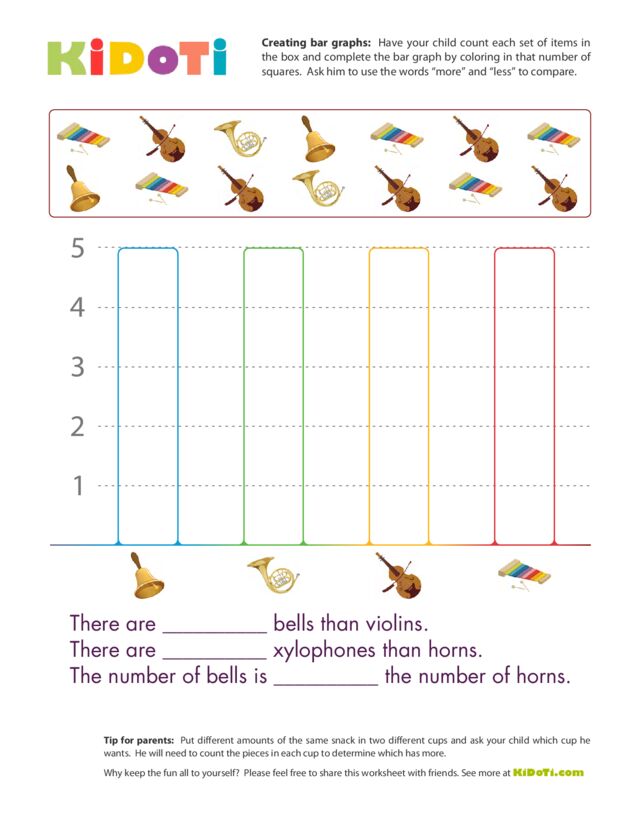
Bar graphs are an easy way for children to quickly compare different groups of items. By putting the different items along the horizontal axis of the bar graph and the number of items along the vertical axis of the bar graph, children can estimate how many of each item is depicted by observing how tall the column is. Also, children can count the exact number of items either by counting each individual block in the column or by observing the number on the left of the graph that corresponds to the height of each column.
Tips for parents
Encourage comparisons. When putting away your child’s laundry, encourage him to make observations about his clothing. For example, ask him to compare how many blue shirts and red shirts he has using the words “more” or “less.” Also encourage your child to use the descriptive words “more than” and “less than.” For example, at snack time ask him if he would like more cherries than crackers or more crackers than cherries. Being comfortable using these comparative terms will help him explain what he sees as he looks at pictographs.
Make pictographs instead of normal lists. Transform your shopping list into a pictograph by, for example, drawing 6 small pictures of a banana instead of writing “6 bananas.” Then let your child hold the pictograph at the store and remind you how many of each item to buy. If you are worried about your artistic skills, you can cut pictures of different foods out a magazine or off the internet to create your shopping list pictograph.
Activities to try at home to supplement the graphing worksheets
- Using all the shoes in your closet, challenge your child to create a three dimensional bar graph on your closet floor by putting all sneakers in one column, all sandals in a second column, and all dress shoes in a third column. Then challenge him to say which group of shoes has the most. Or, have him make a bar graph on your dining table by lining up different types of glasses and mugs.
- As you are putting away your child’s clothes, ask him to count how many shirts he has in the closet or how many pairs of pants he has. Ask him which item of clothing he has the most of, which item of clothing he has the least of, and which items he has the same amount of. Then consider going into your closet and having him compare the number of shirts he has with the number of shirts you have, for example. Later, your child can record this information with a bar graph.
- Say aloud two numbers (such as 6 and 12) and have your child say which number is bigger. Then suggest two different numbers and have your child say which number is smaller. Or, point out speed limit signs as your drive with your child. Explain how a 20 MPH limit means you need to go slower than a 65 MPH limit, for example, since 20 is less that 65. The more you child is able to readily identify which number is larger and which number is smaller, the easier it will be more him to make comparisons about different items recorded on a bar graph worksheet.
- Put different amounts of the same snack in two different cups and ask your child which cup he wants. First, ask him to make a guess about which container holds more items, based on the height the snack reaches in the cup. Then ask him to count the pieces in each cup to determine which has more, recording the information on a bar graph.